这个“低调到不行”的 Chrome 新功能,能帮你省下成片时间
最近,Chrome 上线了 Performance Extensibility API。它让开发者能把“自己关心的信号”直接塞进 DevTools 的 Performance 面板里可视化。我啃了好一阵官方文档(密不透风不夸张),现在把精华捋给你。
你大概也经历过:在无穷无尽的面板里来回横跳,找不到关键线索,越看越糊涂。
掌控你的指标:把“你在乎的”搬进 Performance 面板Performance Extensibility API 允许你在 DevTools 的 Performance 面板里自定义轨道(track)与自定义事件,等于给你的应用做一份“专属体检报告”。从基础开始最稳。
先来看最小闭环:在页面里埋点、量时间、打印结果。
复制
<script>performance.mark(cssStart);</script>
<linkrel="stylesheet"href="/app.css">
<script>
performance.mark(cssEnd);
performance.measure(cssTime, cssStart, cssEnd);
</script>1.2.3.4.5.6.7.8.
上面做了三件事:
用 performance.mark() 打点 cssStart;加载样式;再打点 cssEnd 并用 performance.measure() 量两点之间的耗时。想快速看数据?控制台直接取:
复制
console.log(`CSS Start: ${performance.getEntriesByName(cssStart)[0].startTime} ms`);
console.log(`CSS Duration: ${performance.getEntriesByName(cssTime)[0].duration} ms`);1.2.
同理,JavaScript 片段也能这样测:
复制
performance.mark(jsStart);
// 模拟一段“费时”的 JS
setTimeout(() => {
performance.mark(jsEnd);
performance.measure(jsTime, jsStart, jsEnd);
console.log(performance.getEntriesByName(jsStart)[0].startTime);
console.log(performance.getEntriesByName(jsTime)[0].duration);
}, 1000);1.2.3.4.5.6.7.8.9.10.
为什么要进 Performance 面板?
console.log():轻量与即时,不必全量录制就能看到数字;Performance 面板:把你的标记与网络/脚本/渲染等系统轨道并排对照,全景式排查更直观。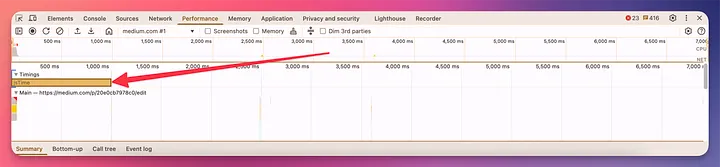 图片
图片
新 API 的关键点在于:
你可以声明自定义 Track,把事件放到属于你的一条线上;还能为 mark/measure 添加丰富的细节,在 DevTools 中直接可视化。先开启自定义 Track 能力:
 图片
图片
然后,给 mark 增加 DevTools 识别信息(dataType: marker):
复制
performance.mark(jsStart, {
detail: {
devtools: {
dataType: marker
}
}
});
// 模拟一段“费时”的 JS
setTimeout(() => {
performance.mark(jsEnd, {
detail: {
devtools: {
dataType: marker
}
}
});
performance.measure(jsTime, jsStart, jsEnd);
console.log(performance.getEntriesByName(jsStart)[0].startTime);
console.log(performance.getEntriesByName(jsTime)[0].duration);
}, 5000);1.2.3.4.5.6.7.8.9.10.11.12.13.14.15.16.17.18.19.20.21.22.
把上面代码贴进浏览器控制台,切到 Performance,录几秒。
接着,把 measure 放到自定义的 Track 上:
复制
performance.measure(jsTime, {
start: jsStart,
end: jsEnd,
detail: {
devtools: {
track: JavaScript Custom Tracker - Amit
}
}
});1.2.3.4.5.6.7.8.9.
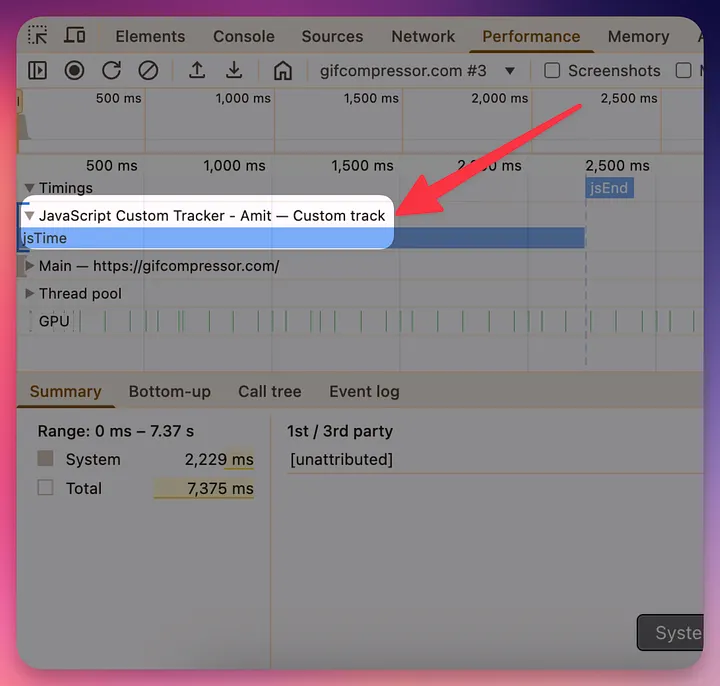 图片
图片
下面这段 HTML 把 CSS 加载全过程“打点→量时→标注”为一条自定义轨。保存为 .html 后用 Chrome 打开,开始录制即可。
复制
<!doctype html>
<htmllang="en-gb">
<metacharset="utf-8">
<metaname="viewport"content="width=device-width, minimum-scale=1.0">
<title>Extensibility API</title>
<script>
performance.mark(cssStart, {
detail: {
devtools: {
dataType: "marker",
tooltipText: Get Bootstrap CSS from CDN,
color: "secondary-light"
}
}
});
</script>
<linkrel="stylesheet"href="https://cdn.jsdelivr.net/npm/bootstrap@5.3.3/dist/css/bootstrap.min.css"id="jsCSS">
<script>
performance.mark(cssEnd);
// 抓取该样式的资源级计时信息
const css = document.getElementById(jsCSS);
const cssURL = css.href;
const cssTimingInformation = performance.getEntriesByName(cssURL)[0];
const cssTransferSize = (cssTimingInformation.transferSize / 1024).toFixed(2);
const cssDecodedBodySize = (cssTimingInformation.decodedBodySize / 1024).toFixed(2);
const cssLatencyDuration = (cssTimingInformation.responseStart - cssTimingInformation.startTime).toFixed(2);
const cssdownloadDuration = (cssTimingInformation.responseEnd - cssTimingInformation.responseStart).toFixed(2);
</script>
<script>
performance.measure(cssTime, {
start: cssStart,
end: cssEnd,
detail: {
devtools: {
dataType: track-entry,
trackGroup: Third Party Instrumentation,
track: CSS,
tooltipText: CSS Downloaded and Parsed,
color: secondary-light,
properties: [
[URL, cssURL],
[Transferred Size, `${cssTransferSize} KB`],
[Decoded Body Size, `${cssDecodedBodySize} KB`],
[Queuing & Latency, `${cssLatencyDuration} ms`],
[Download, `${cssdownloadDuration} ms`]
]
}
}
});
</script>
</html>1.2.3.4.5.6.7.8.9.10.11.12.13.14.15.16.17.18.19.20.21.22.23.24.25.26.27.28.29.30.31.32.33.34.35.36.37.38.39.40.41.42.43.44.45.46.47.48.49.50.51.52.53.54.55.56.57.
看点在哪里?
你不仅能看到“从请求到解析”的总耗时,还能拆分:排队/首包延迟、下载时长、传输体积、解码体积;这些细节直接展示在自定义条目上,鼠标悬停即可读懂;当它与网络/主线程/渲染/JS 采样轨并排时,瓶颈会“自己跳出来”。实操建议(真能省时间的部分)先埋点,后录制:把你怀疑的路径都放上 mark/measure,用命名来表达意图(如 route:home→product)。一条轨讲一件事:用 detail.devtools.track 归类,避免把所有事件堆到 Timings。用属性说人话:把 URL、大小、分段时长等放进 properties,减少“录完还要再翻 Request 面板”的往返。短录多次:与其录 60s 看花眼,不如录 5–10s 聚焦一条链路,逐段定位。对照回放:修一次就录一次,延迟/抖动/主线程阻塞是否下降,一眼即判。总结今天我们把 Performance Extensibility API 的核心玩法走了一遍:
mark/measure 打点量时;detail.devtools 把事件“搬进”自定义轨;“属性 + 提示 + 颜色”让复盘更高效;配合 Performance 面板的系统轨道,定位更快,沟通更顺。下一次你怀疑“页面慢在某一步”,别再盲猜。埋点→录制→证据说话,你会省下成片时间。
THE END