引言
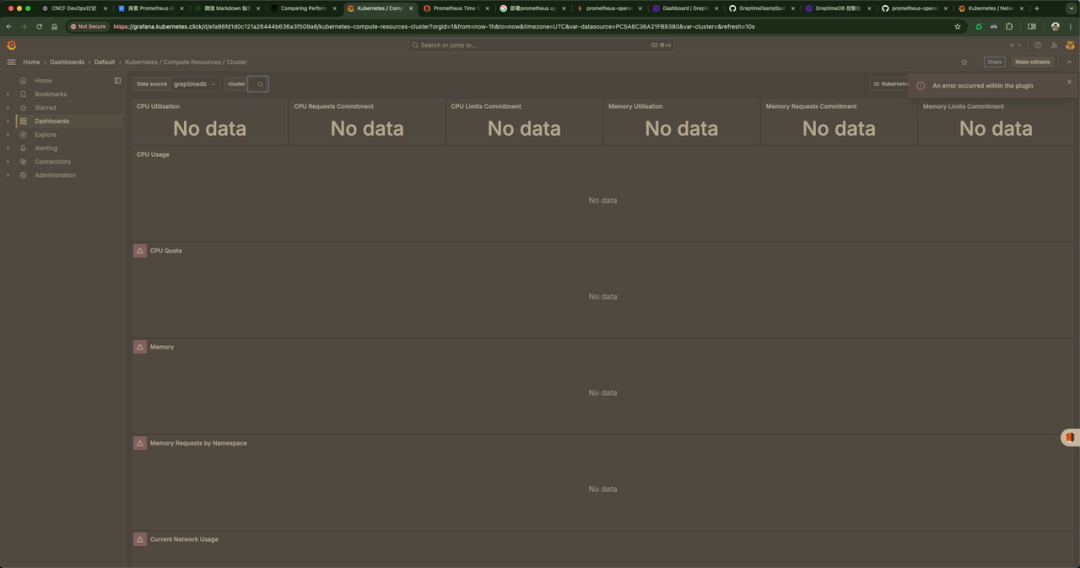
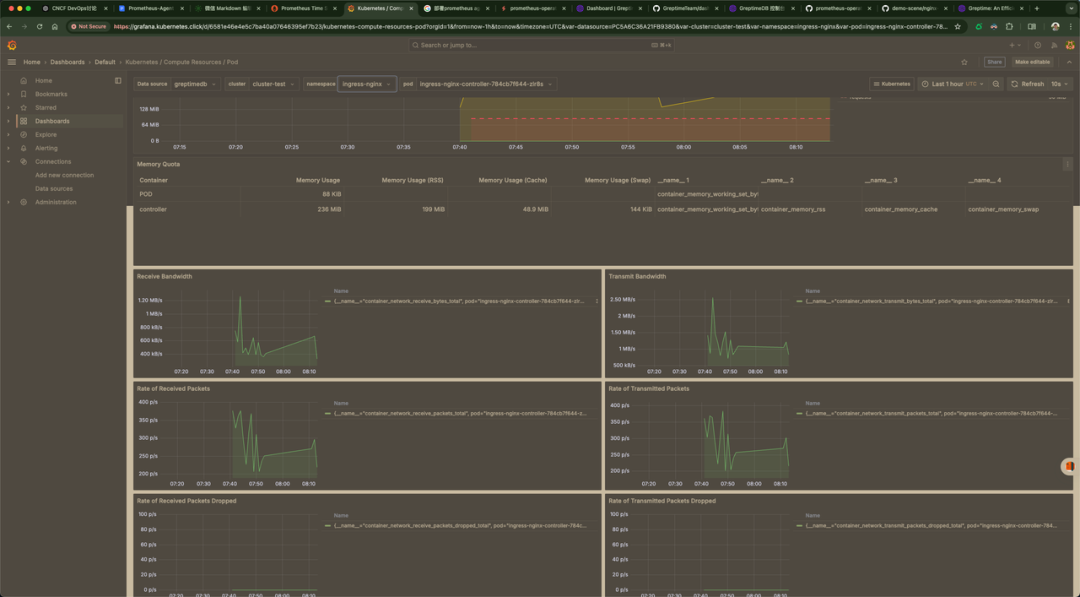
我们的上一篇文章中讲解到了 Prometheus-Agent + GreptimeDB,当时最大的问题是使用 GreptimeDB 作为 Grafana 的数据源,然后去看 Dashboard 有很多的都没有数据,如下图所示
 图片
图片
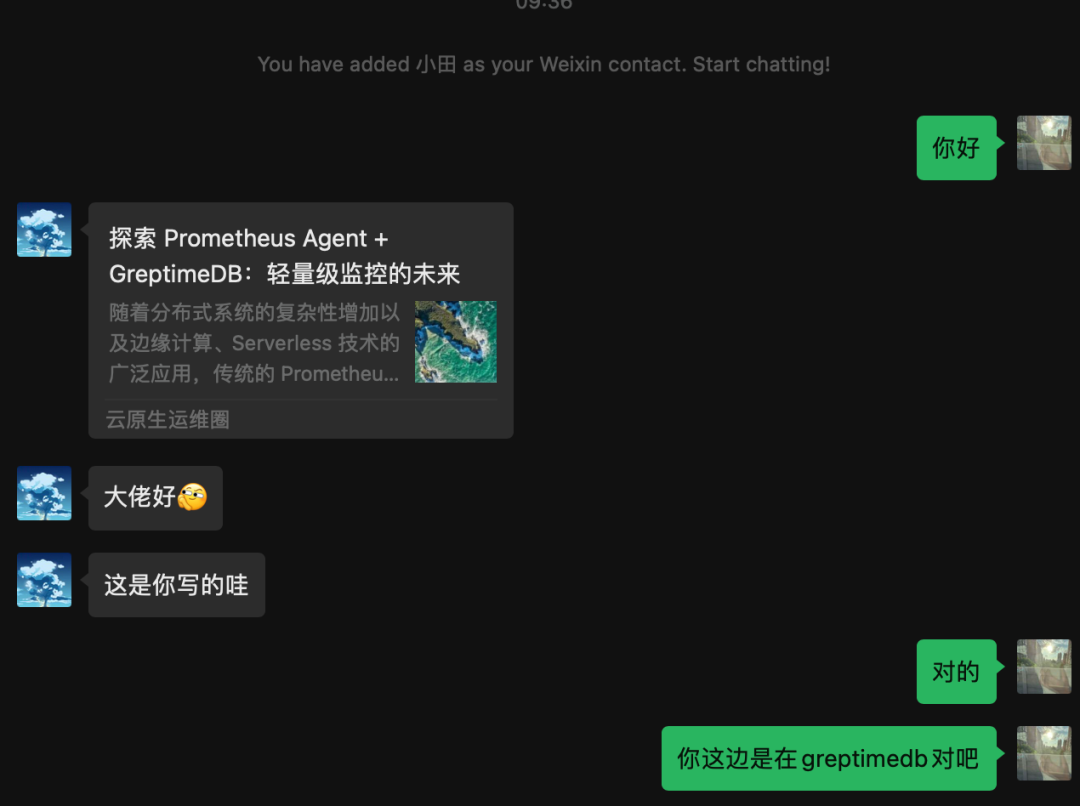
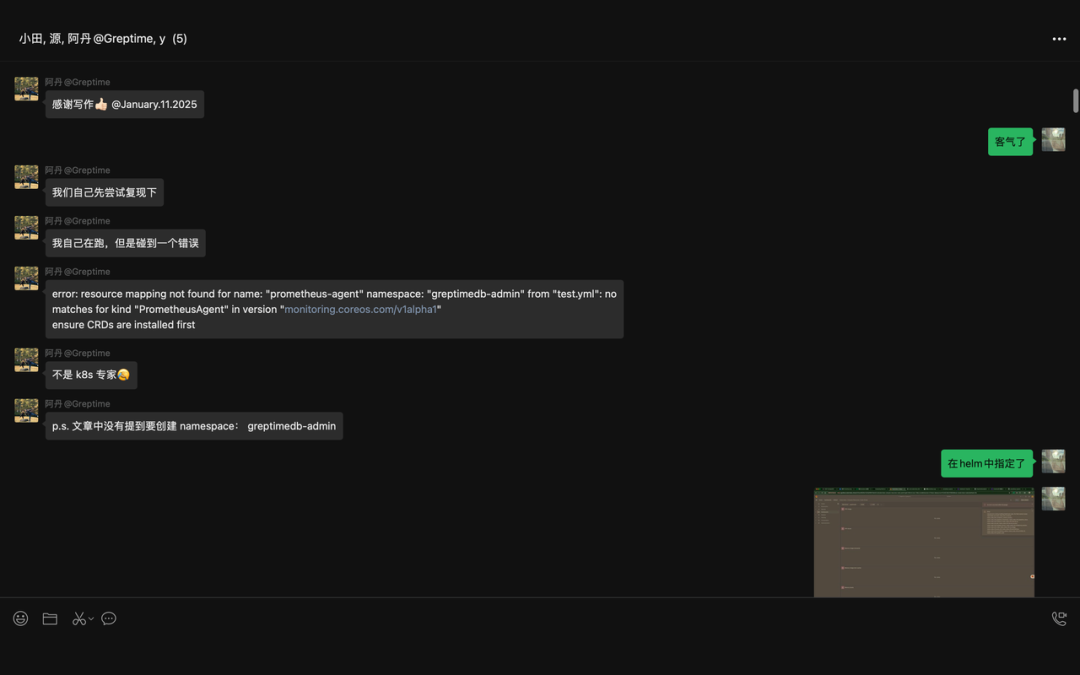
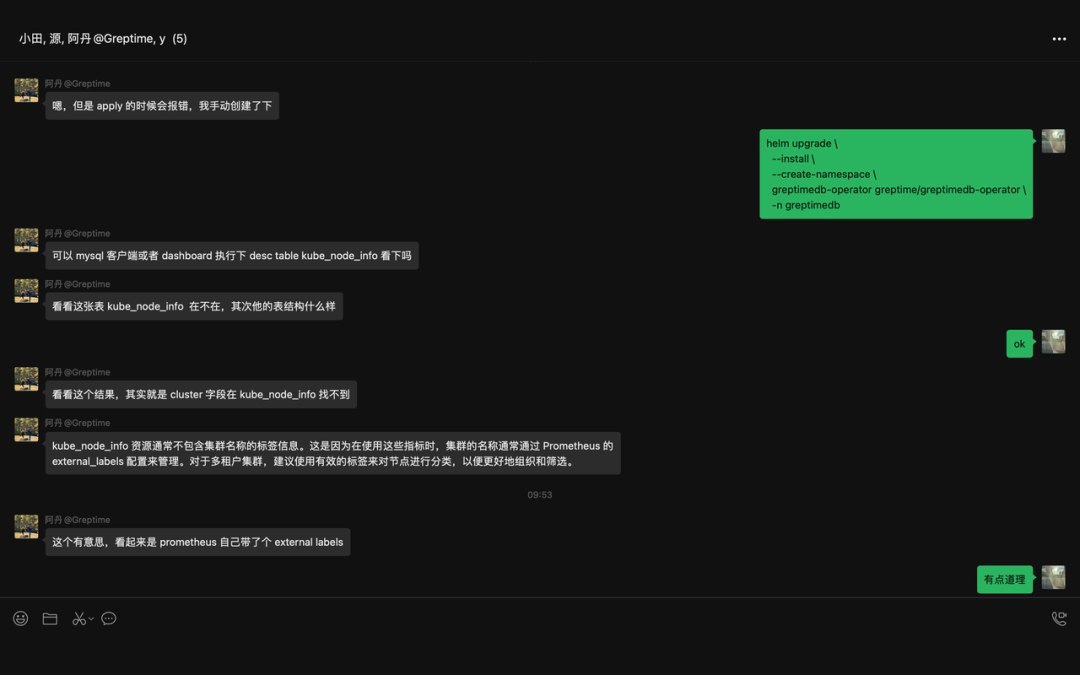
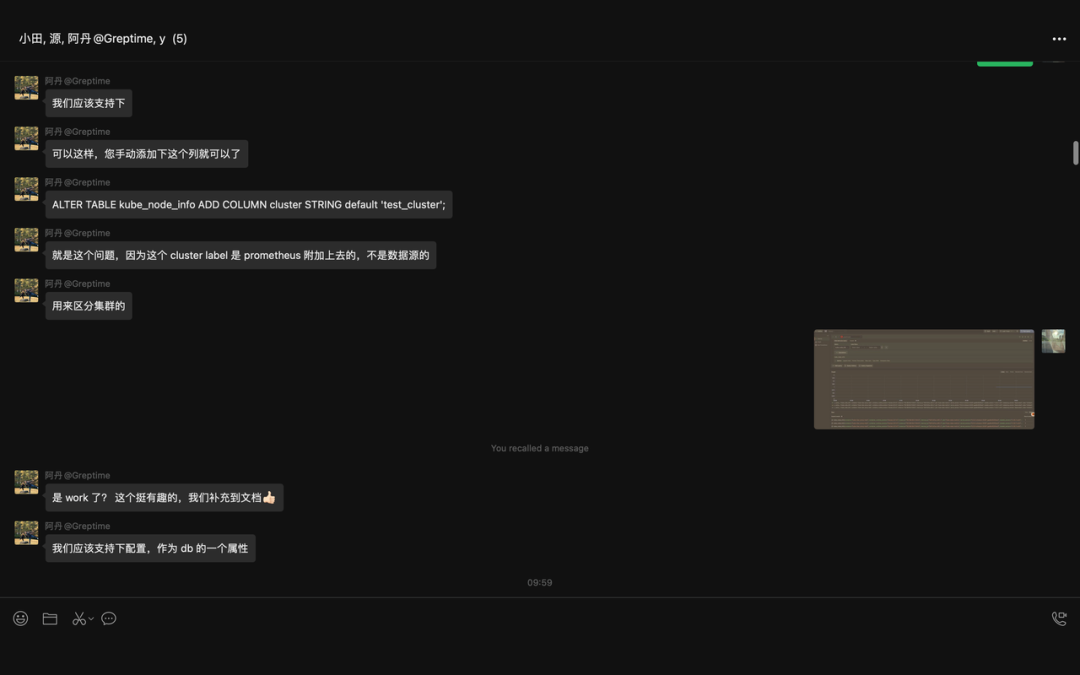
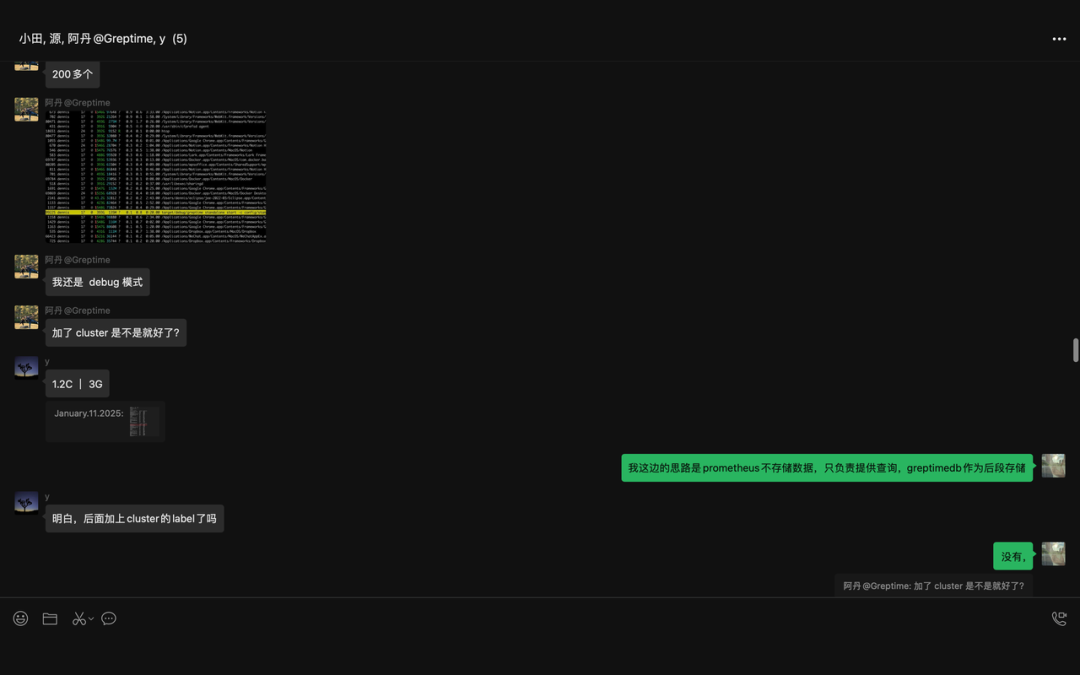
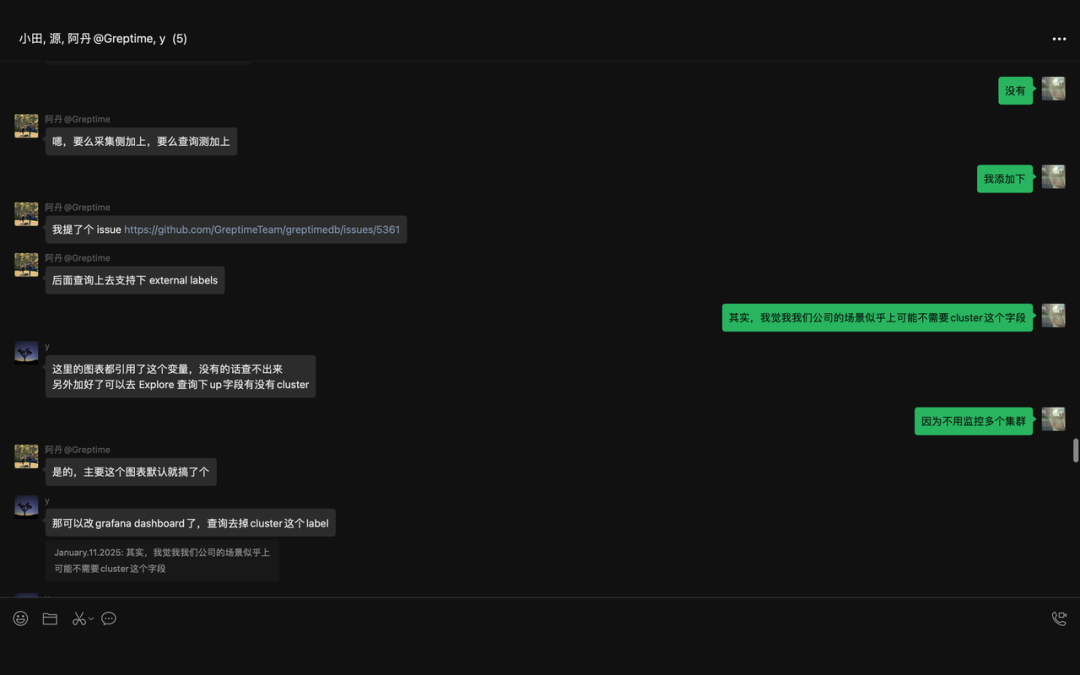
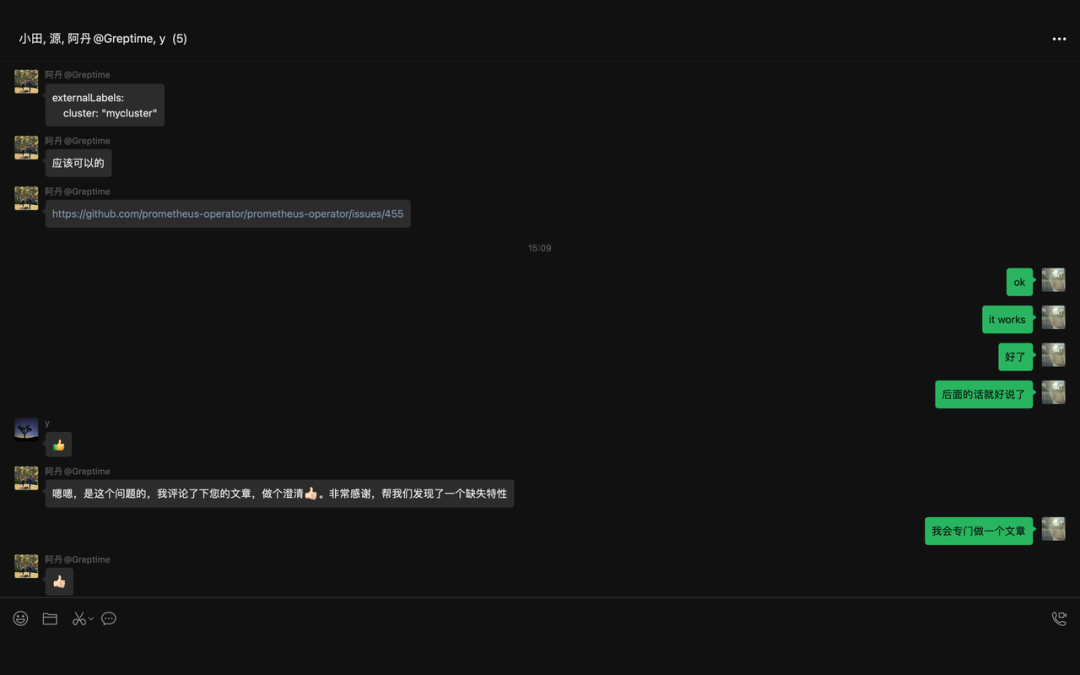
当时文章一经发出,就收到了来自 GreptimeDB[1] 官方人员的注意,随后,我们经过进一步的交流,如下图所示
 图片
图片
 图片
图片
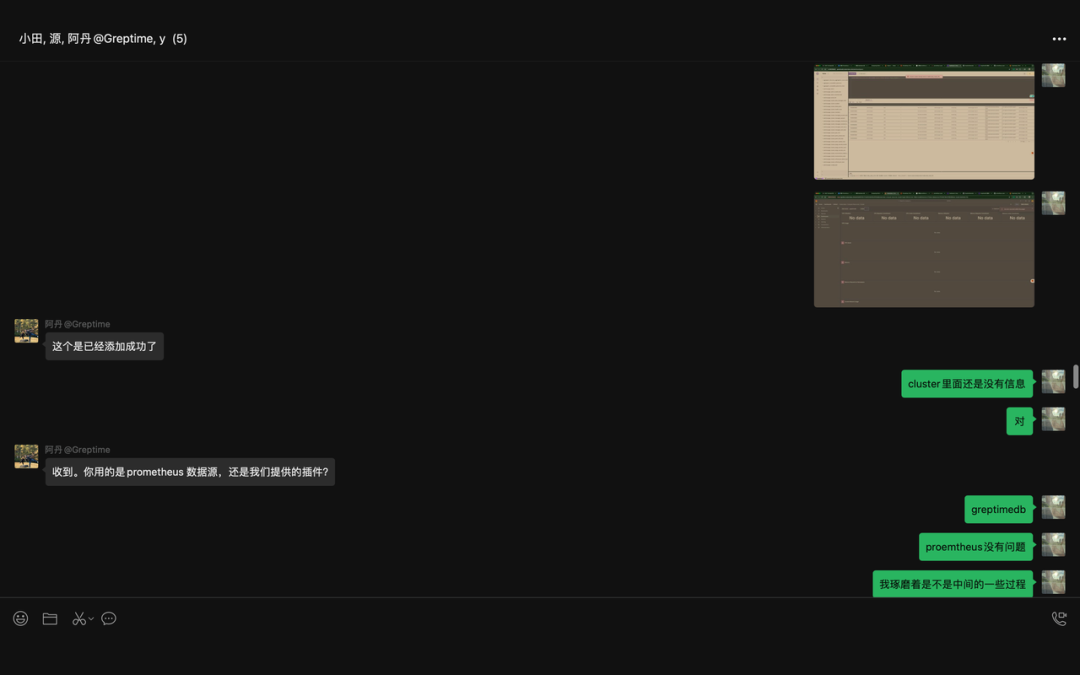
随后,我们进入群聊
 图片
图片
 图片
图片
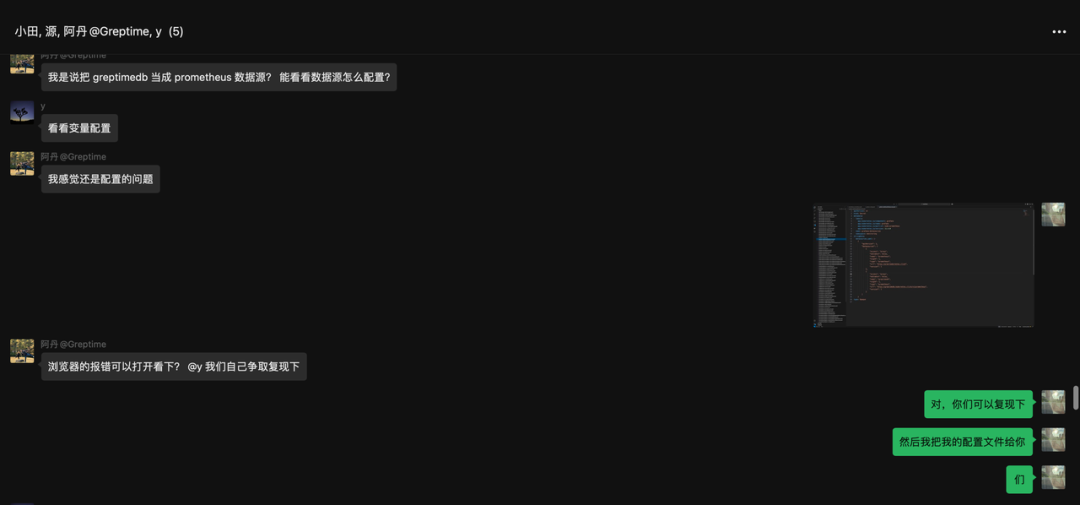
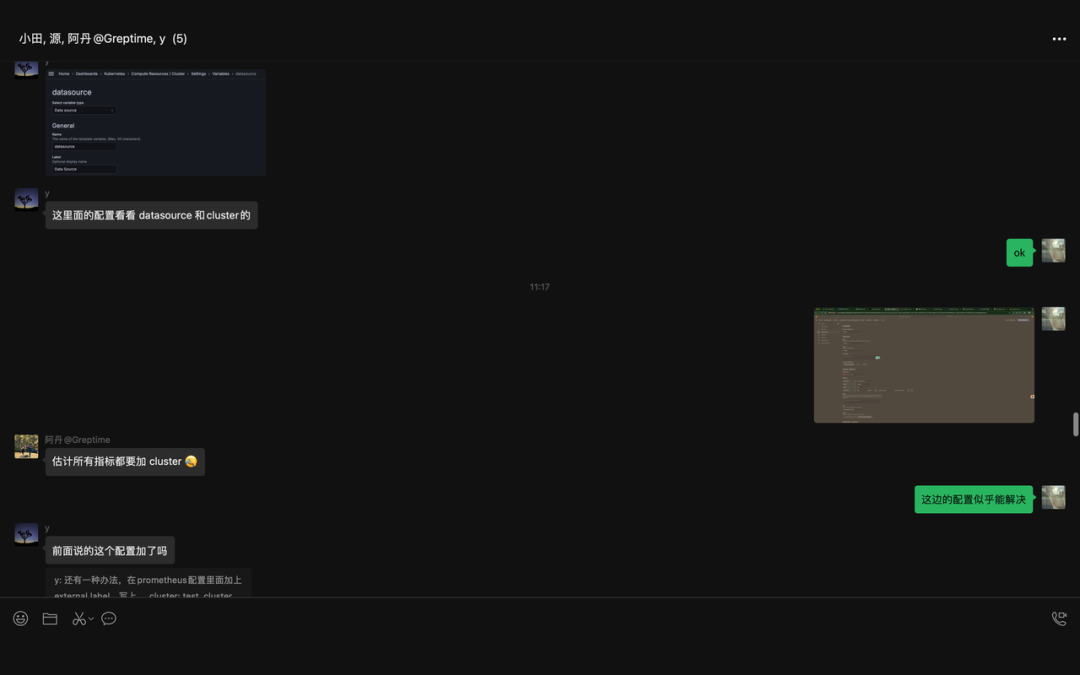
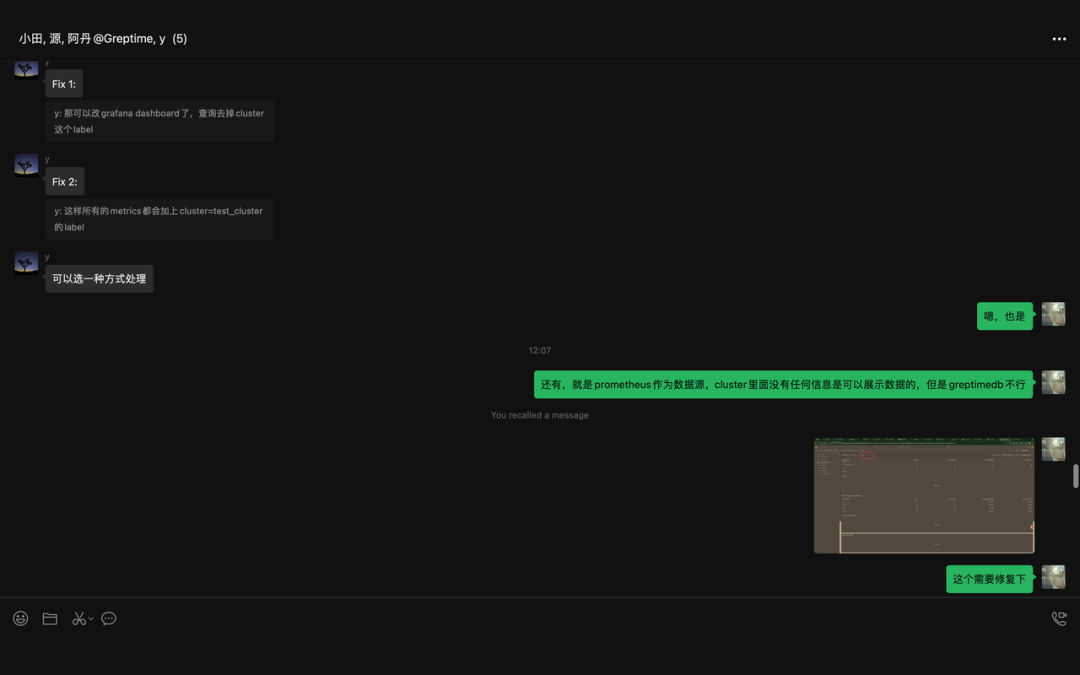
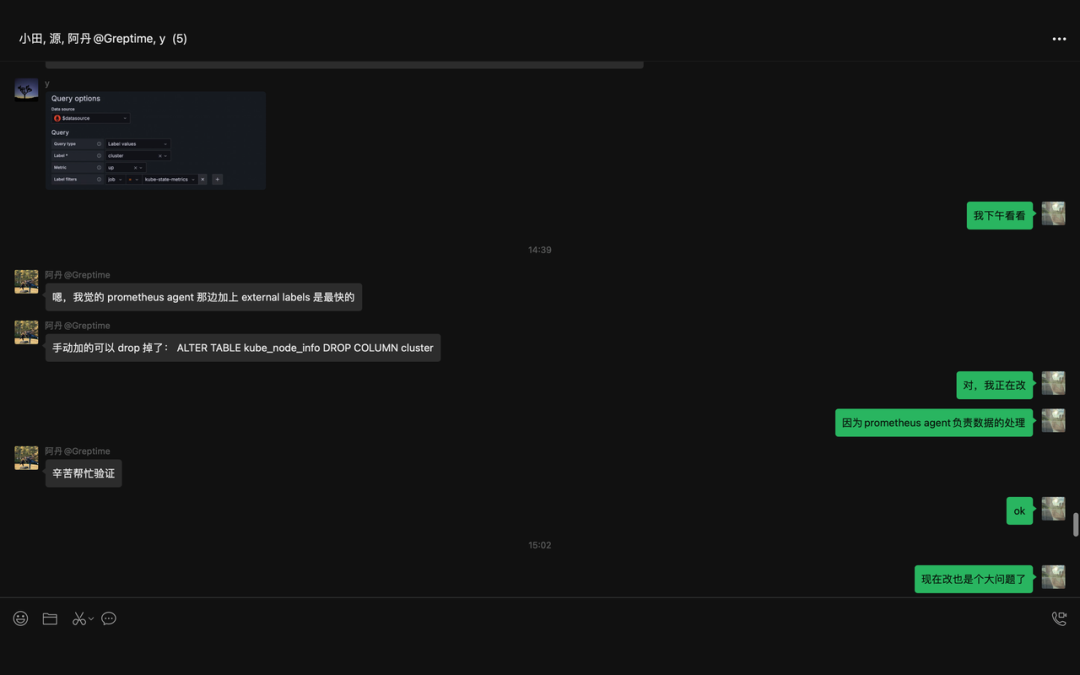
以下的这部分算是 get 到了终点,但是当时并没有立刻采取行动
 图片
图片
 图片
图片
 图片
图片
 图片
图片
 图片
图片
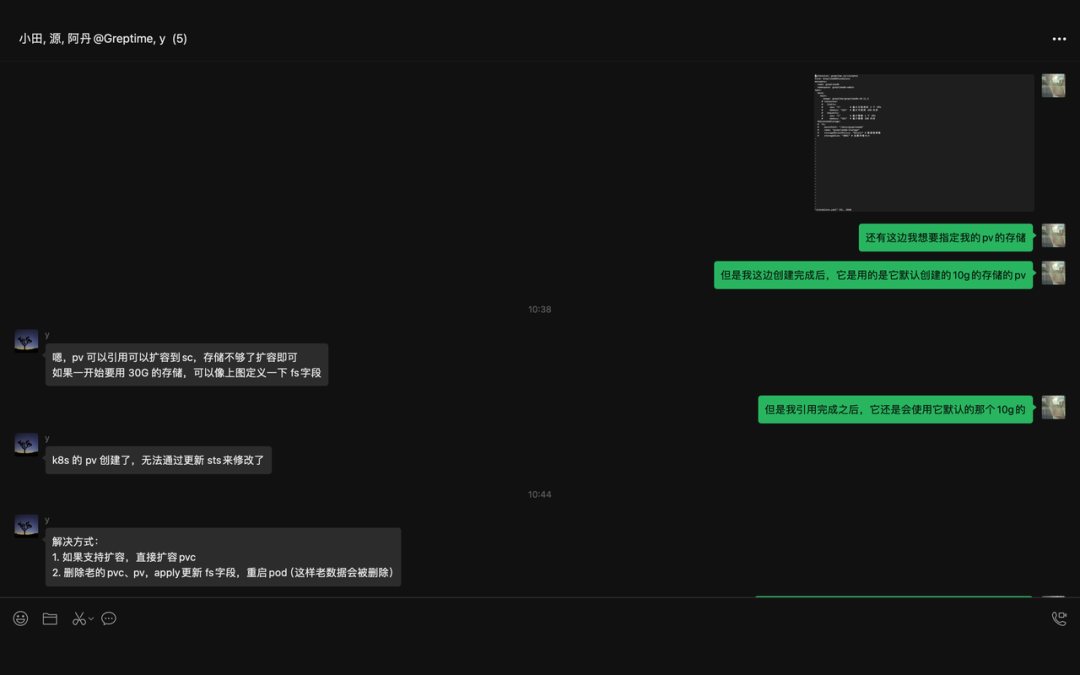
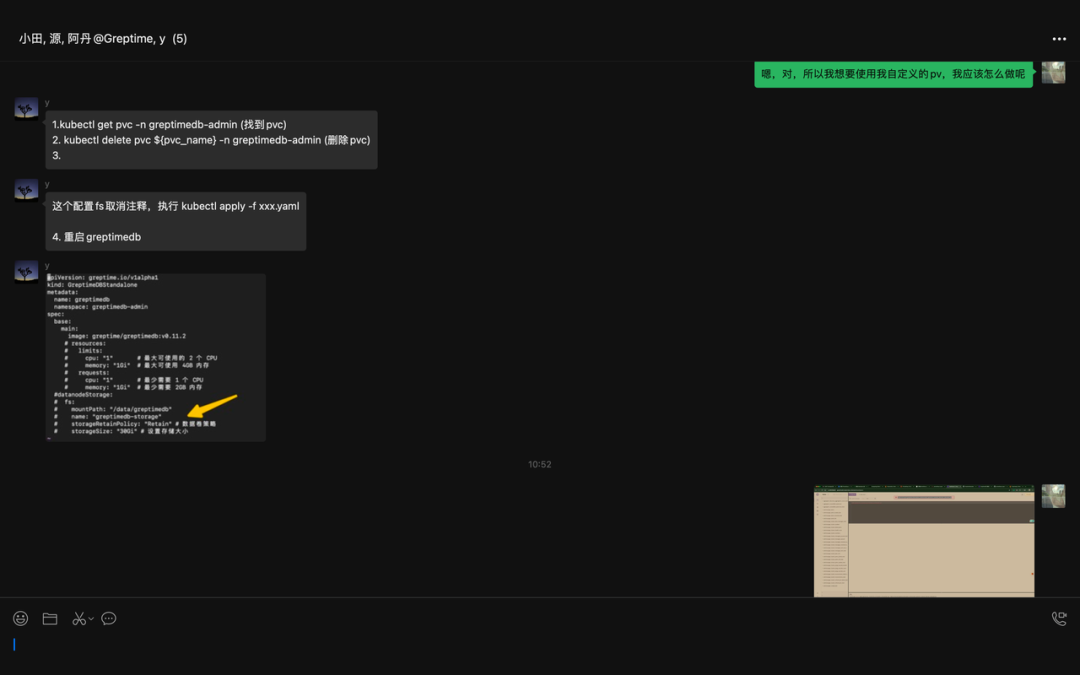
到了后面,我想着怎么给 GreptimeDB 弄一个自定义的存储,因为它的这个 控制器 创建完成后,就会自动创建 PV 和 PVC 然后挂载,10G 的存储,但是我想要自定义,如下 YAML。
复制
apiVersion: greptime.io/v1alpha1
kind: GreptimeDBStandalone
metadata:
name: greptimedb
namespace: greptimedb-admin
spec:
base:
main:
image: greptime/greptimedb:v0.11.2
# resources:
# limits:
# cpu: "1" # 最大可使用的 2 个 CPU
# memory: "1Gi" # 最大可使用 4GB 内存
# requests:
# cpu: "1" # 最少需要 1 个 CPU
# memory: "1Gi" # 最少需要 2GB 内存
datanodeStorage: # 我这里没有定义 StorageClassName 是因为它会去使用 default 的
fs:
mountPath: "/data/greptimedb"
name: "greptimedb-storage"
storageRetainPolicy: "Retain" # 数据卷策略
storageSize: "30Gi"1.2.3.4.5.6.7.8.9.10.11.12.13.14.15.16.17.18.19.20.21.22.
然后我们部署看看;
复制
jacobleo@Jacobs-MacBook-Air greptimedb % kg pvc -A
NAMESPACE NAME STATUS VOLUME CAPACITY ACCESS MODES STORAGECLASS VOLUMEATTRIBUTESCLASS AGE
greptimedb-admin greptimedb-storage-greptimedb-standalone-0 Bound pvc-160dd148-b272-439f-b8e1-f480def01bfc 30Gi RWO local-path <unset> 36s
monitoring grafana-pvc Bound pvc-5cd3dc87-bda9-45aa-b02c-f54112b49a2b 30Gi RWO local-path <unset> 5h3m
monitoring prometheus-k8s-db-prometheus-k8s-0 Bound pvc-e6daef05-4ff1-42bf-b4f0-2b459d3a6f12 1Gi RWO local-path <unset> 5h2m
monitoring prometheus-k8s-db-prometheus-k8s-1 Bound pvc-e294d11d-4099-4ba8-ade8-24eed34f79de 1Gi RWO local-path <unset> 5h2m1.2.3.4.5.6.
可以看到是 30G,并没有我们上面说的那个问题,原来是我搞错了,我们下面这个关于存储的问题就解决了。
 图片
图片
 图片
图片
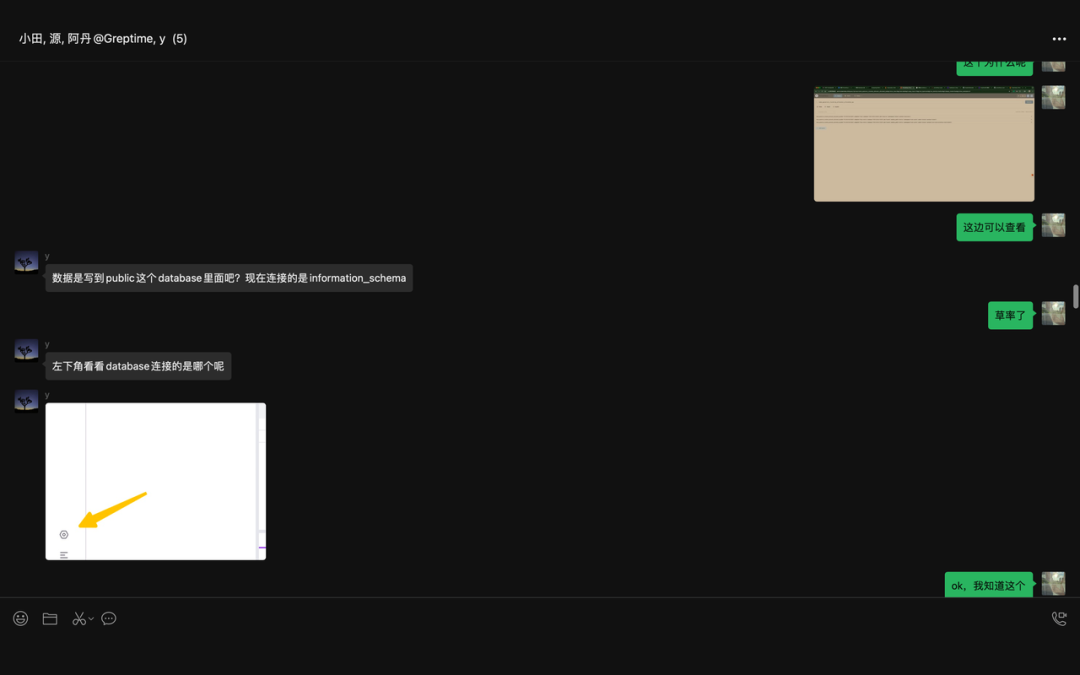
这边当时也挺搞笑的,哈哈!
 图片
图片
 图片
图片
 图片
图片
 图片
图片
 图片
图片
 图片
图片
 图片
图片
 图片
图片
 图片
图片
 图片
图片
 图片
图片
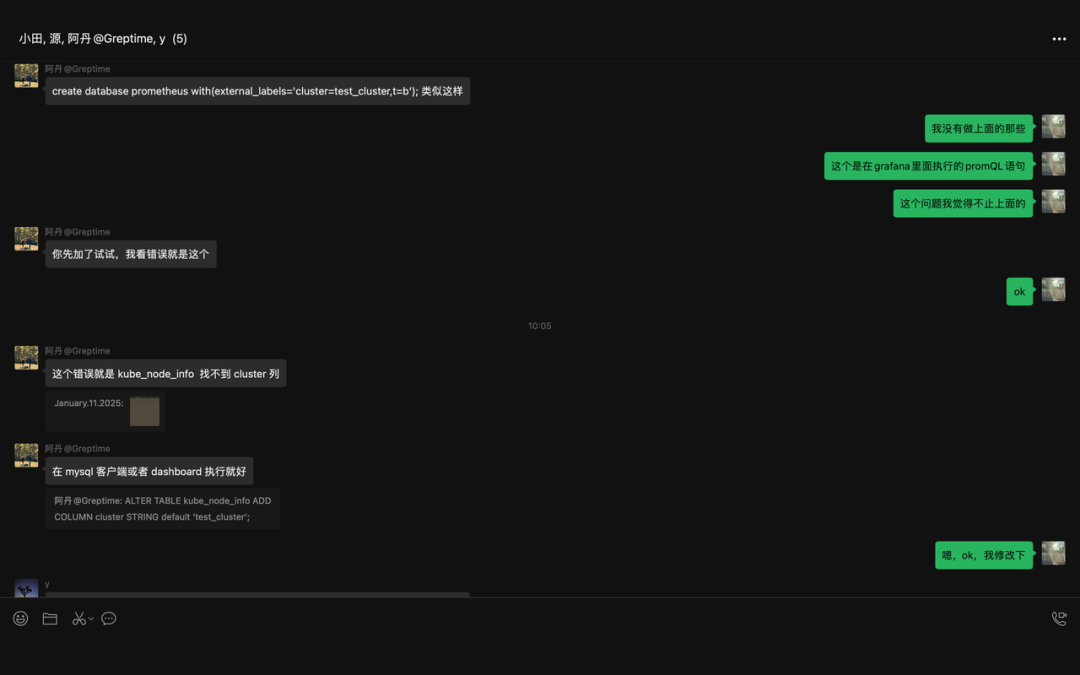
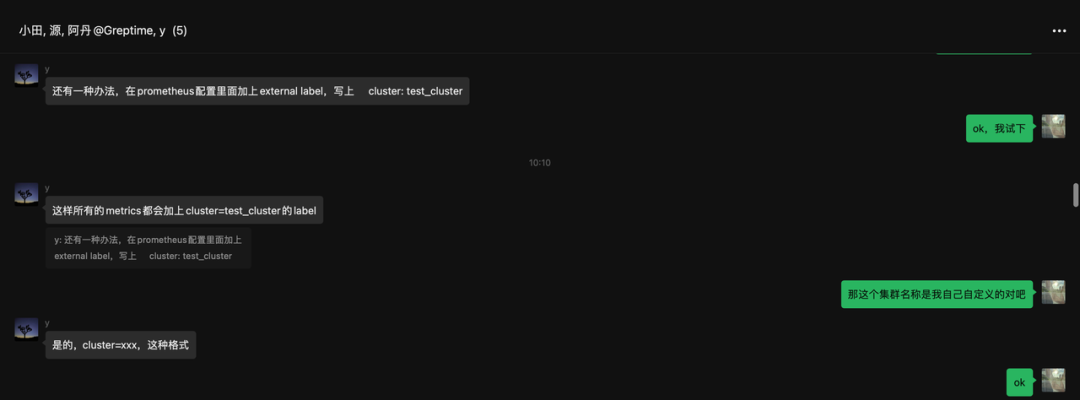
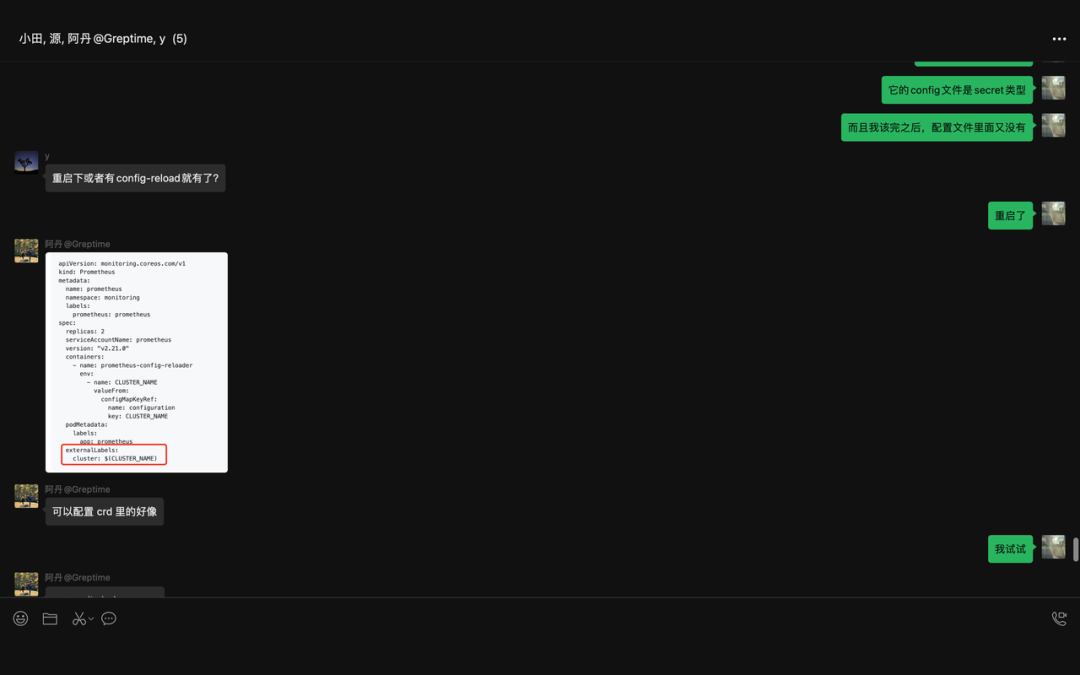
我们这里添加下:
这里添加就 work 了,然后如果还有更多的,就继续添加就可以了。
复制
·····
externalLabels:
cluster: "cluster-test"
·····1.2.3.4.
 图片
图片
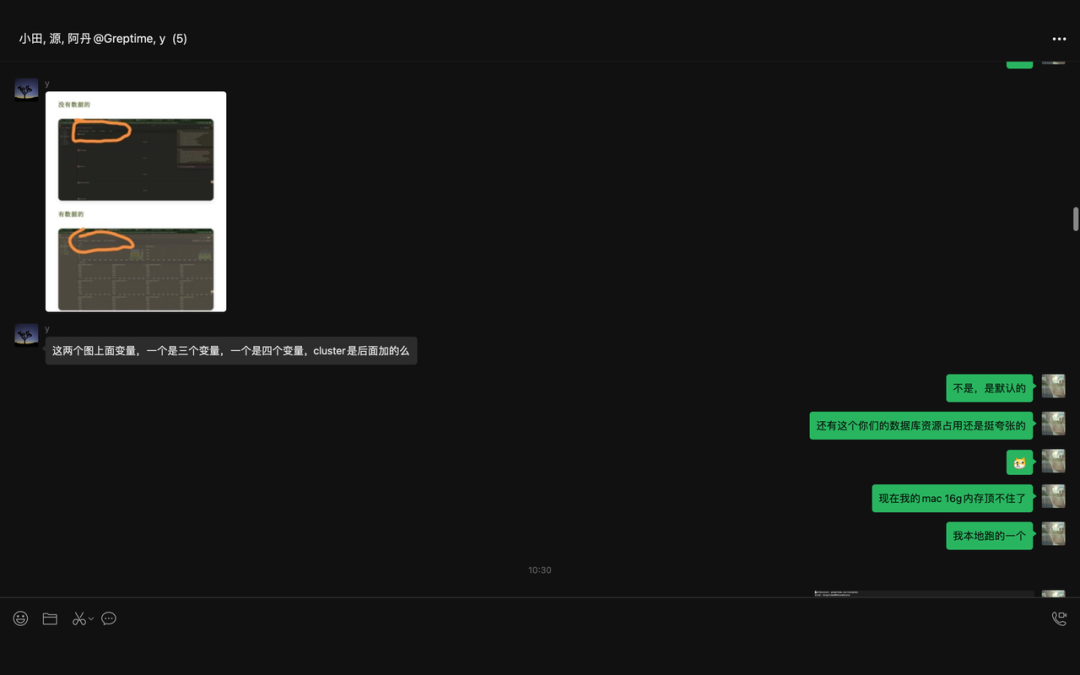
可以看到,终于有数据了。
 图片
图片
但是这又有一个问题,其实还有很多像这样类似的问题,大致解决,和上面的是一样的思路。
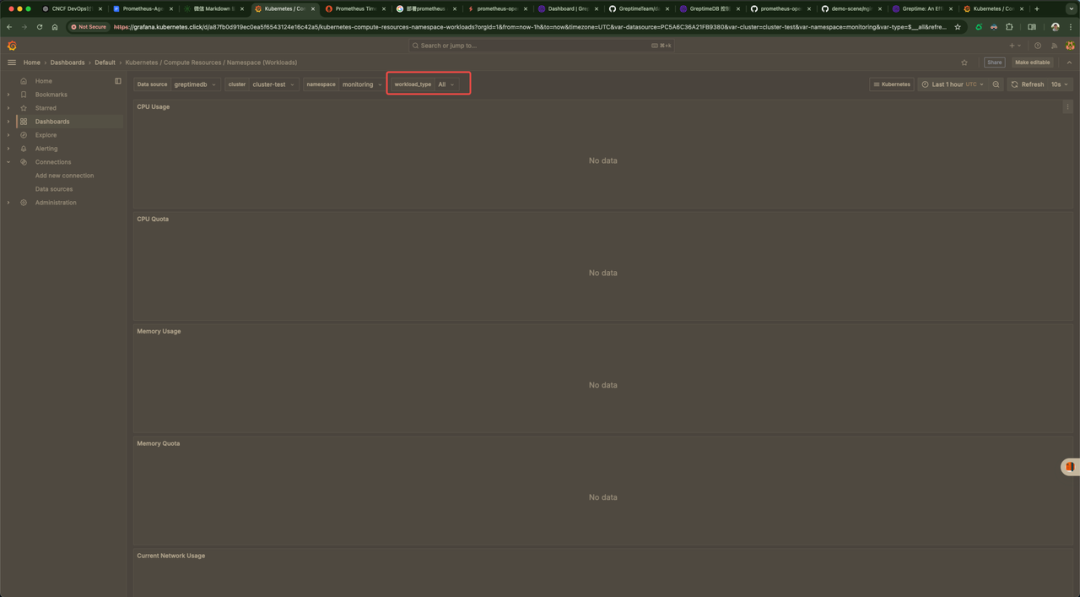 图片
图片
我们添加下就可以了。
复制
·····
externalLabels:
cluster: "cluster-test"
workload_type: "deployment, stateful"
·····1.2.3.4.5.
弄了半天,还是不行,在此希望有大佬出主意,非常感谢,作为回报,我会把你记在心里!
可以看下我们最终的 YAML 文件;
复制
apiVersion: v1
kind: ServiceAccount
metadata:
name: prometheus-agent
namespace: greptimedb-admin
---
apiVersion: rbac.authorization.k8s.io/v1
kind: ClusterRole
metadata:
name: prometheus-agent
rules:
- apiGroups: [""]
resources:
- namespaces
- secrets
- persistentvolumeclaims
verbs: ["get", "list", "watch"]
- apiGroups: ["monitoring.coreos.com"]
resources: ["servicemonitors", "podmonitors", "prometheuses"]
verbs: ["get", "list", "watch"]
- apiGroups: [""]
resources:
- nodes
- nodes/metrics
- services
- endpoints
- pods
verbs: ["get", "list", "watch"]
- apiGroups: [""]
resources:
- configmaps
verbs: ["get"]
- apiGroups:
- discovery.k8s.io
resources:
- endpointslices
verbs: ["get", "list", "watch"]
- apiGroups:
- networking.k8s.io
resources:
- ingresses
verbs: ["get", "list", "watch"]
- nonResourceURLs: ["/metrics"]
verbs: ["get"]
---
apiVersion: rbac.authorization.k8s.io/v1
kind: ClusterRoleBinding
metadata:
name: prometheus-agent
roleRef:
apiGroup: rbac.authorization.k8s.io
kind: ClusterRole
name: prometheus-agent
subjects:
- kind: ServiceAccount
name: prometheus-agent
namespace: greptimedb-admin
---
apiVersion: monitoring.coreos.com/v1alpha1
kind: PrometheusAgent
metadata:
name: prometheus-agent
namespace: greptimedb-admin
spec:
image: quay.io/prometheus/prometheus:v3.0.1
replicas: 1
serviceAccountName: prometheus-agent
enableFeatures:
- agent
remoteWrite:
- url: "http://greptimedb.kubernetes.click/v1/prometheus/write?db=public"
queueConfig:
capacity: 5000
maxSamplesPerSend: 10000
batchSendDeadline: 5s
serviceMonitorSelector: {}
serviceMonitorNamespaceSelector: {}
podMonitorNamespaceSelector: {}
podMonitorSelector: {}
resources:
limits:
cpu: "2"
memory: "4Gi"
requests:
cpu: "1"
memory: "2Gi"
externalLabels:
cluster: "cluster-test"
workload_type: "deployment, stateful"1.2.3.4.5.6.7.8.9.10.11.12.13.14.15.16.17.18.19.20.21.22.23.24.25.26.27.28.29.30.31.32.33.34.35.36.37.38.39.40.41.42.43.44.45.46.47.48.49.50.51.52.53.54.55.56.57.58.59.60.61.62.63.64.65.66.67.68.69.70.71.72.73.74.75.76.77.78.79.80.81.82.83.84.85.86.87.88.89.
结语
这个问题,还可以,不算是特别过分吧,还是跌亏有 GreptimeDB 的相关人员,不然,这个问题怎么解决?
那么我们的 Prometheus-Agent + GreptimeDB 算是不是很圆满地结束了,但是后面大概还会又些小问题,不过都是小事了。
引用链接
[1] GreptimeDB: https://greptime.com/